Welcome to our catch-up, where you’ll be in the know of all the latest Zoho updates in one place!
Zoho CRM Introduces Lookup Filter
Lookup fields help you to associate data from one module to another. That means that you can look up a record from module B and associate it with a record in module A. But, there could be scenarios in which you only want specific records to display while looking up. This is where the Lookup Filter comes in handy.
The Lookup Filter Defined
A Lookup Filter is a new property in the lookup field. It allows you to define criteria, so that only the eligible records from the lookup module are listed during the lookup activity. This makes easier the record association and assures that only eligible and correct information from the database is associated.
How the Lookup Filter Works
To use the filter, go to the lookup field’s property in the Layout Editor, enable the Filter lookup records checkbox, and define the criteria.
Here’s an example: You want only active accounts to be displayed for a lookup field present in the deal module. For this, you can create a filter criteria: Business active is selected.
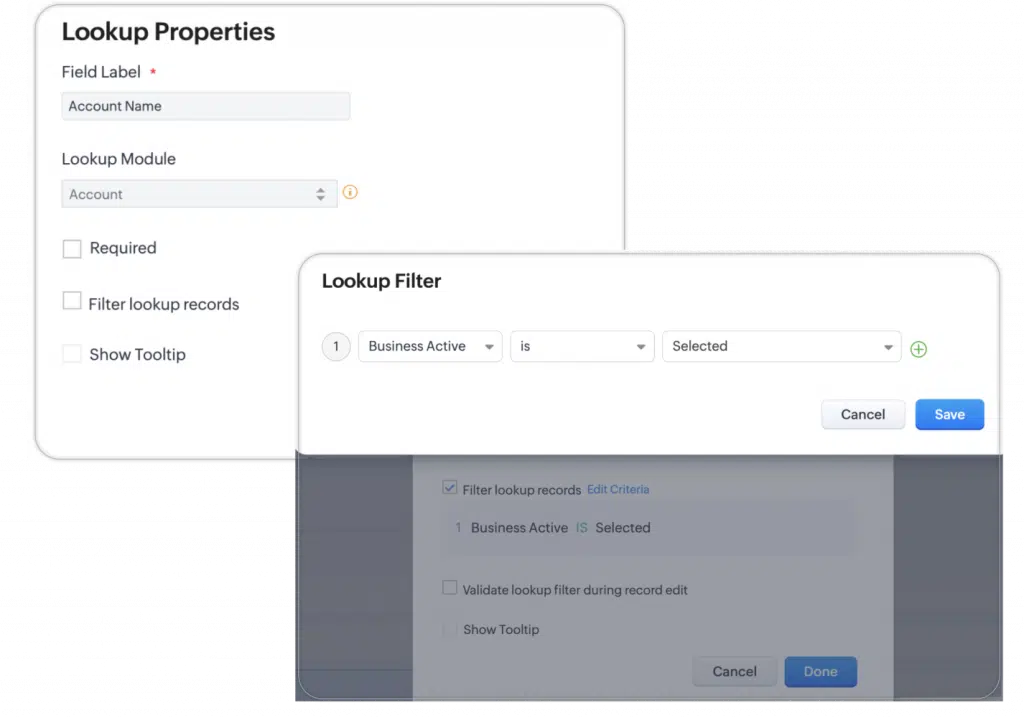
Now, during deal creation, only the active accounts are displayed and associated when a sales rep looks up for accounts. This will help the sales rep to avoid searching throughout an extensive list of records in order to choose the active accounts.

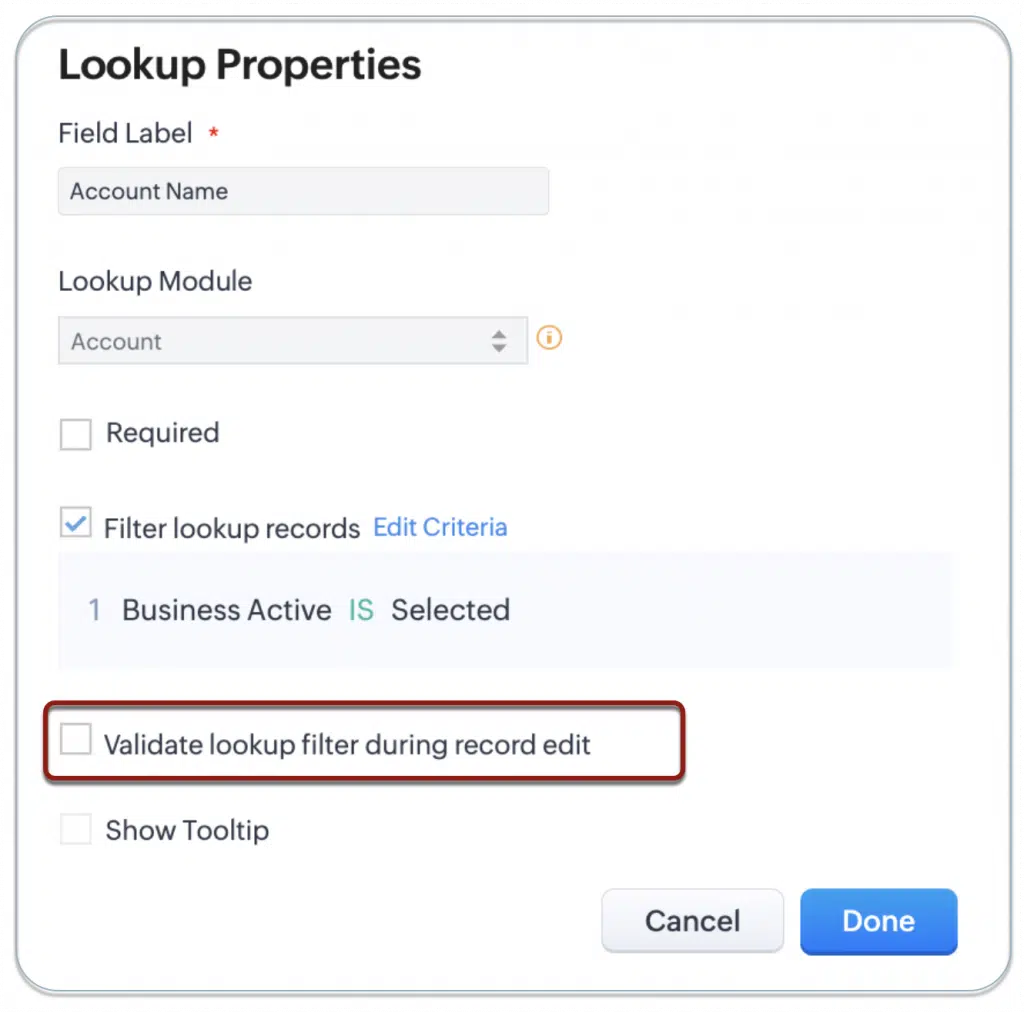
Also, you can opt to validate the filter criteria during while editing the record. For instance, if you want to validate this criterion for an existing deal, you have to enable the validation. After editing every record, the filter will be validated and the record will be saved only if it suits the criteria.
Notes:
- Lookup Filter is supported for the field types Lookup and User Lookup.
- The filter is not currently available for the multi-select lookup field type.
- The option will be available for Enterprise and Ultimate editions of Zoho CRM.
- Lookup Filter is only available in the web version of Zoho CRM, but it will be available soon for mobile devices.
Multiple Updates for Zoho Analytics
Overview and Scroll Bar Effects for Charts
To visualize reports with large data sets, Zoho Analytics has enhanced charts with new interactive options: the Overview and Scroll Bar effects. These allow you to map out large data on a chart to obtain a clear snapshot of the highs and lows in your data.
Dynamic and other interactive scroll charts can now be used to replace filters, which are usually used in reports with large data sets. This allows you to effortlessly compare data by moving the slider or scroll bar.
Benefits of using scroll charts:
- Getting an in-depth analysis by focusing on a specific region.
- Visually comparing data by moving the slider or scroll bar.
- Creating interactive reports that can be used as filters.
Note: To apply scroll effect, your data must be plotted across the axes (X- and Y-axis). You can’t apply it across charts like Map Chart, Pie Chart, etc., which has no axis.
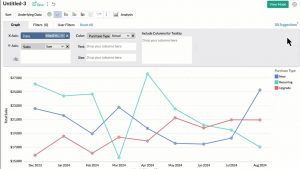
Overview Effect
The Overview Effect adds an overall preview chart (also known as an overview chart) to the bottom of the regular chart. You can adjust the slider in the overview chart to focus on a particular region of the chart for in-depth analysis.
In addition, you can also use the Brush effect in Chart to select and focus on a specific area, which adjusts the slider bounds in the overview chart.
Here’s an example: a report that analyzes the Campaigns data – Impressions vs Clicks vs Conversion. To enable the overview effect in the report:
1. Create a new report or open an existing report to which you want to add the Overview Effect.
2. Select the Settings icon on top right corner of the report.
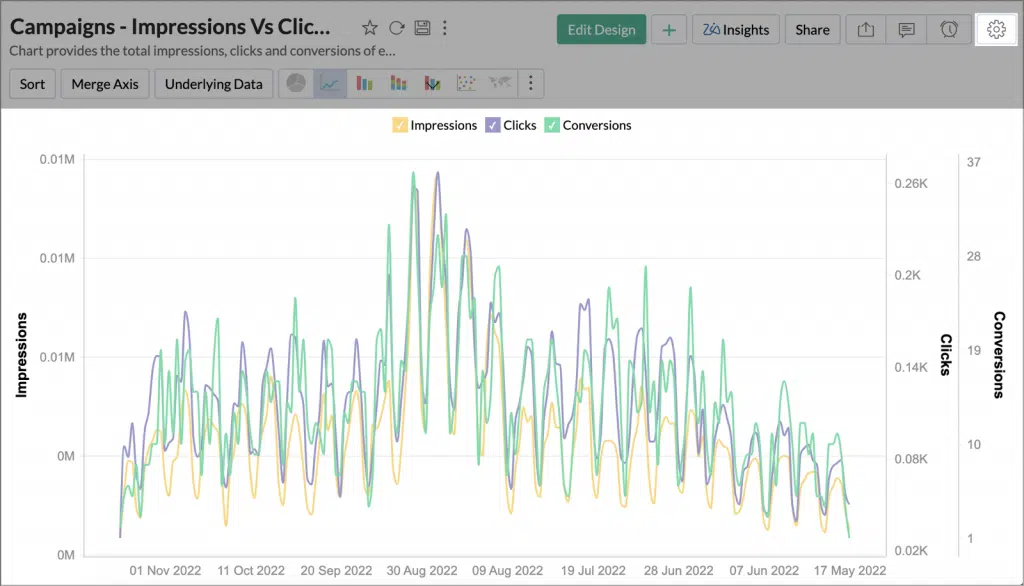
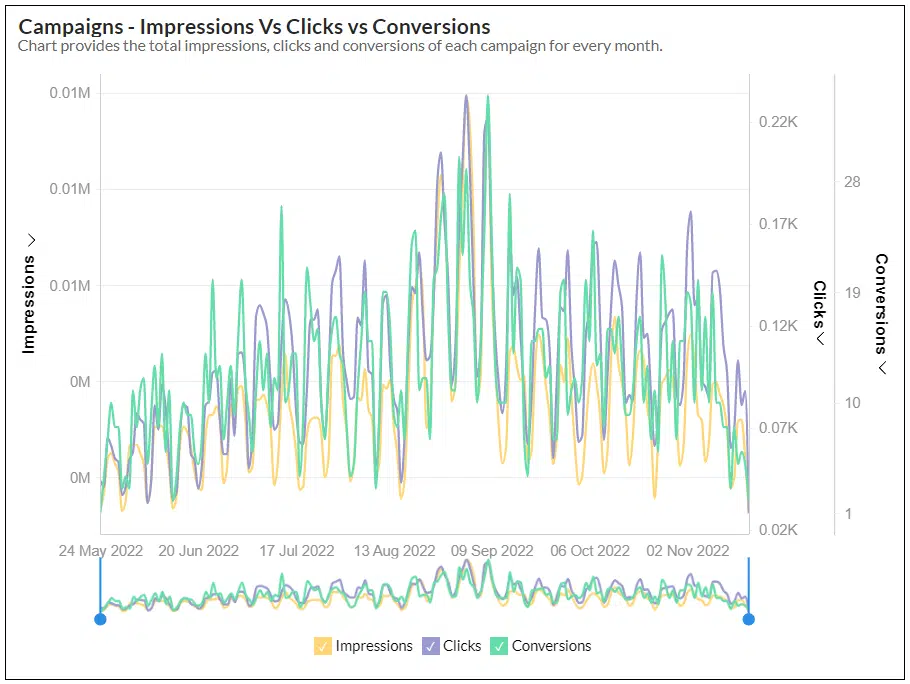
3. Under General Settings, select the Overview Effect from the Overview or Scroll Effect section. Then, click Apply to add the Overview Effect.
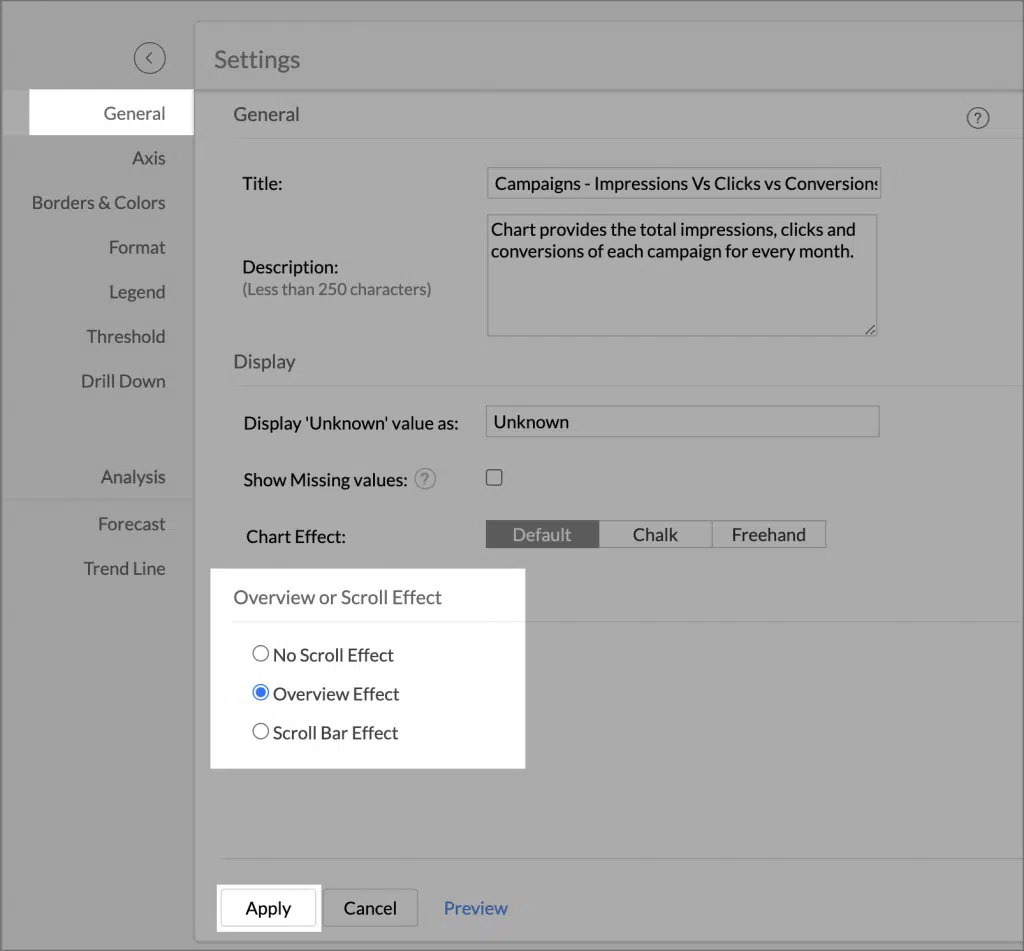
In the chart above, you have added the Overview Effect.
- The overview chart is added at the bottom of the regular chart along with the slider.
- Select an area on the chart to focus on that particular region.
- The slider highlights the selected area on the overview chart. You can also adjust its bound to focus on a region.
- You can move the slider on the overview chart to compare different regions of the chart visually.
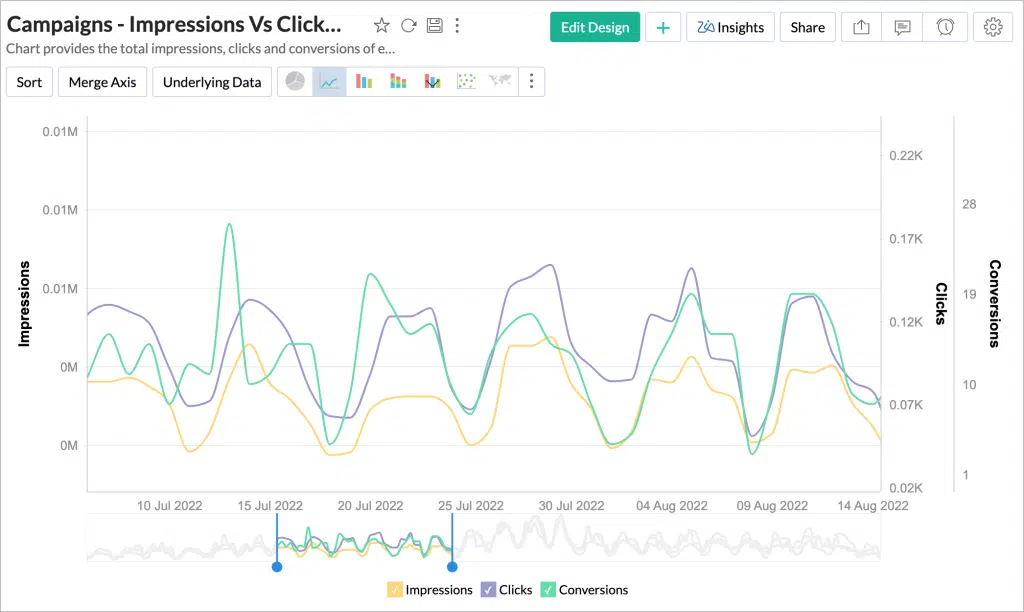
Scroll Bar Effect
Zoho Analytics lets you scroll across reports by using the scroll bar. You can also adjust the thickness of the scroll bar based on the volume of your data. The Scroll Bar Effect is more appropriate for massive data sets comparatively.
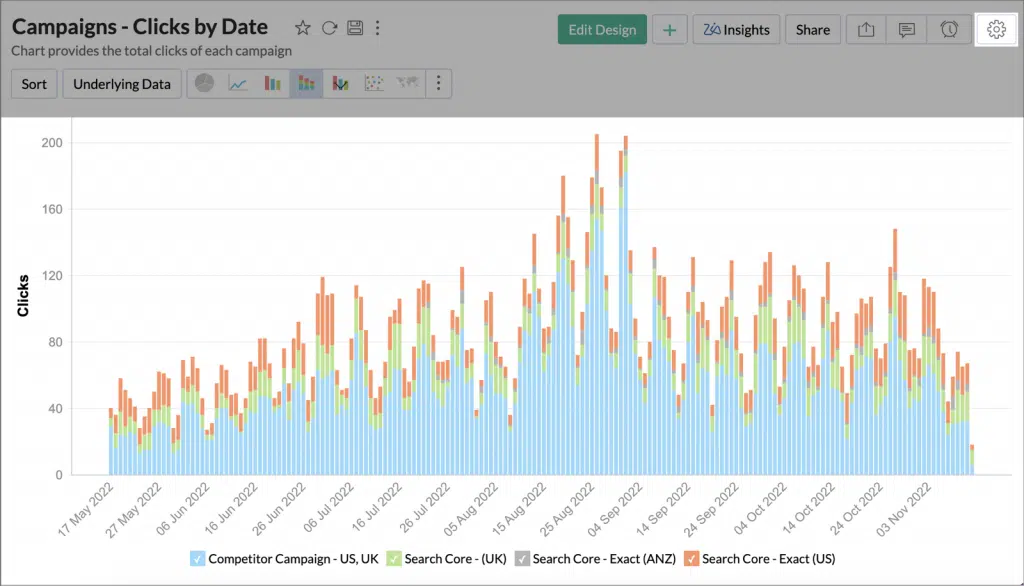
For example, in a report to analyze Campaigns – Clicks by Date, enable the Scroll Bar Effect:
1. Create a new report or open an existing one, to which you want to add the Scroll Bar Effect.
2. Click the Settings icon on the report’s upper right corner.
3. Under General Settings, select the Scroll Bar Effect from the Overview or Scroll Effect section.
4. You can adjust the thickness of the scroll bar by changing the Category Thickness bar based on your data volume.

5. Click Apply to continue.
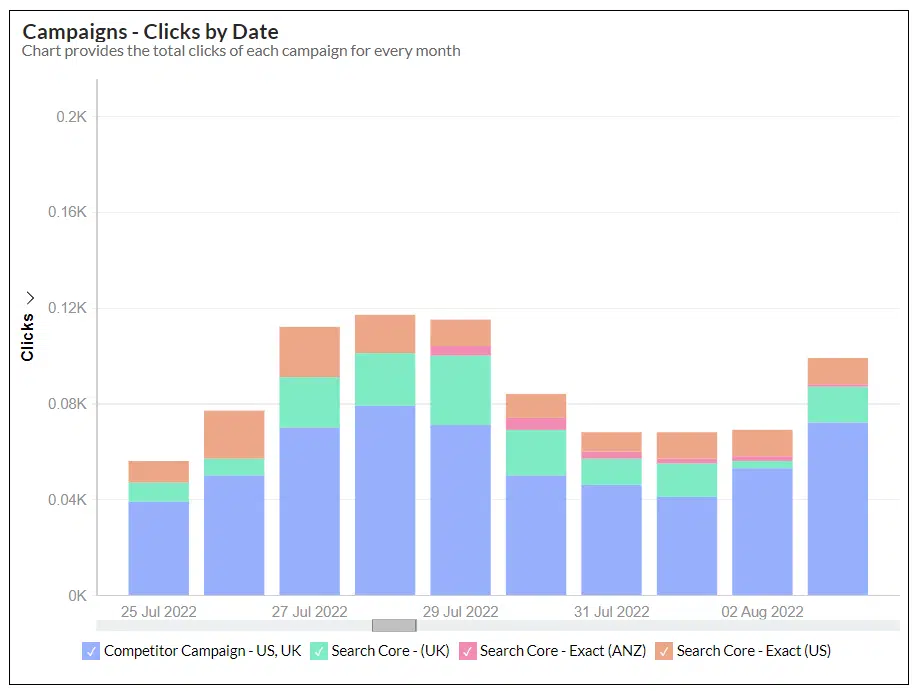
In the chart above, you have added the Scroll Bar Effect.
You can scroll across the report by using the Scroll Bar at the bottom. You can visually compare data throughout different regions by sliding the scroll bar and also get in-depth analysis by adjusting its thickness in Settings.
Image Support for KPI Widgets
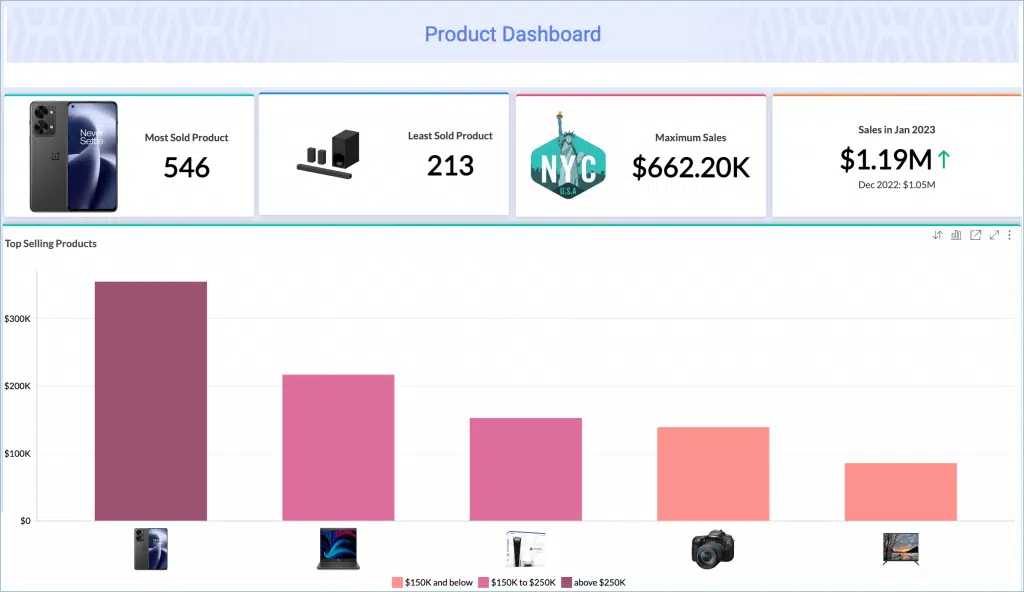
Now you have the option of creating widgets with images (widgets that have images as part of them). Utilizing images in the widgets can help viewers to understand information instantly, as well as distinguish between types.
Zoho Analytics auto adjusts the position of the image based on the text length. In addition, you can customize the position of the images as needed.
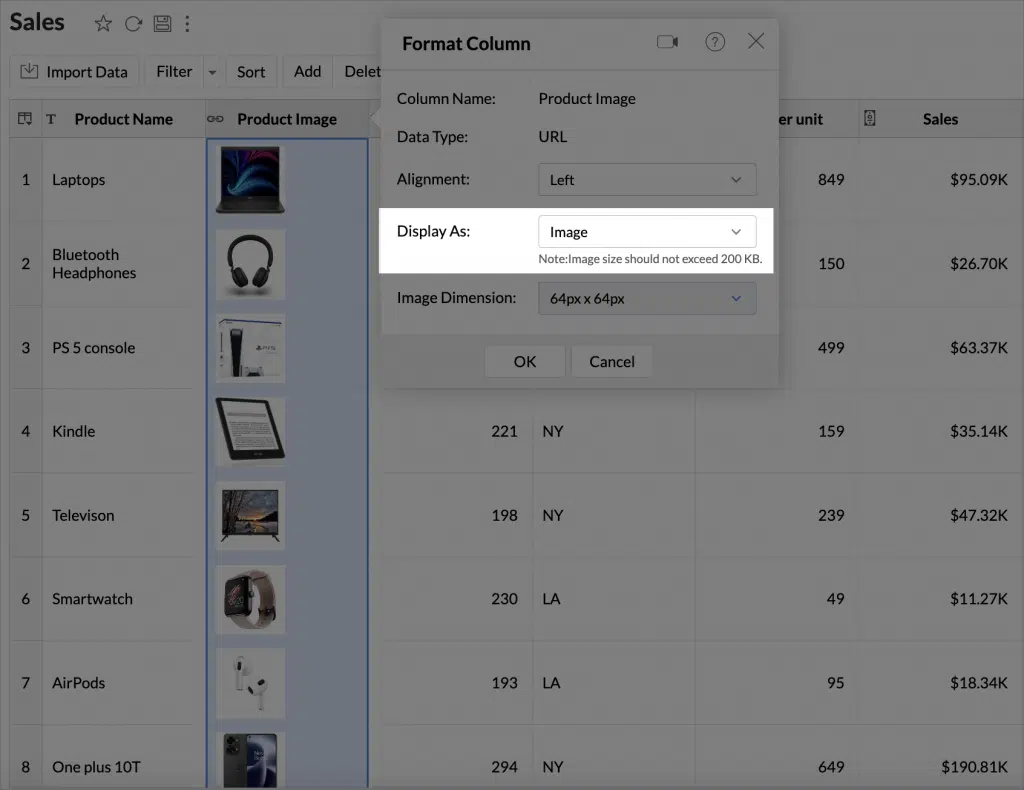
How to Create Widgets with Images
- You need a column that has the images (URLs of image addresses).
- Each image’s size should not exceed 200 KB.
- The Display as option under the Format Column menu must be set to Image.
Improvements in DataPrep
DataPrep During Import
If you have the Zoho DataPrep add-on, you can import your data and use the Prepare Data option to cleanse and prepare your data during import. To do so, follow these steps:
1. Choose the file to be imported.
2. In the Create Table (Import) pane, click Prepare Data.
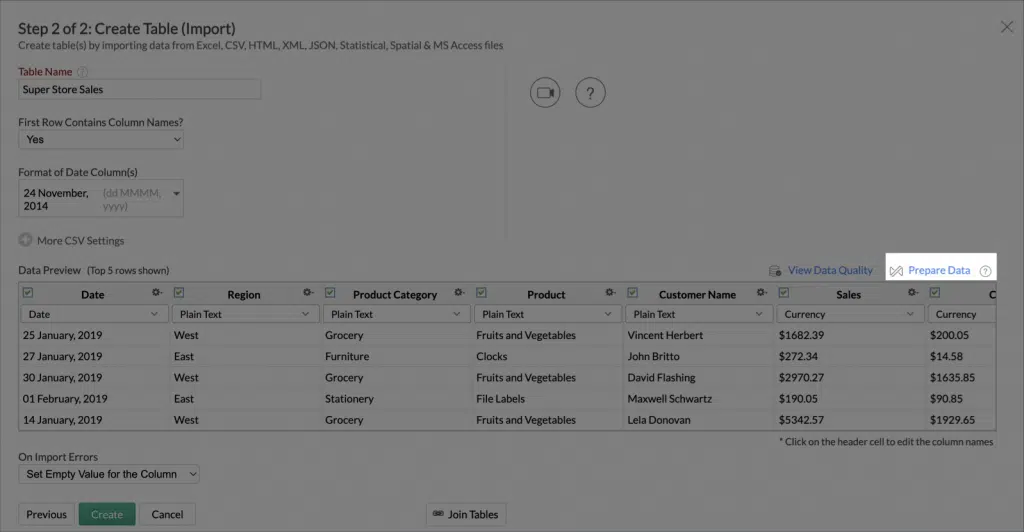
3. The Prepare Data panel will open. You can apply many transformations, like changing number format, Find and Replace, and define rulesets to enrich the data quality.
4. Click Apply Changes.
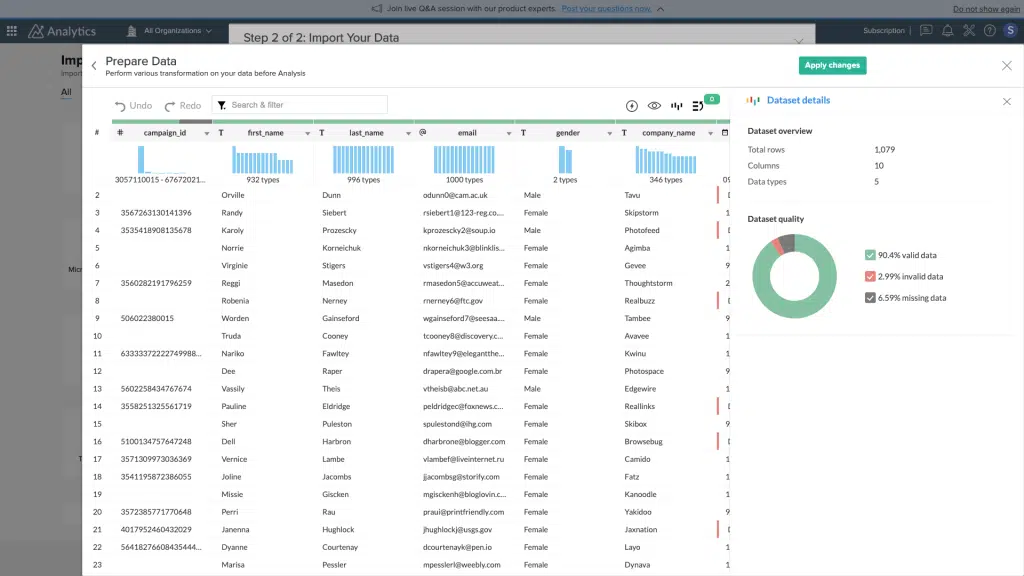
5. The Create Table (Import) pane will open. You can review the Table settings (such as Table Name and First Row Contains Column Name?) and make changes if needed.
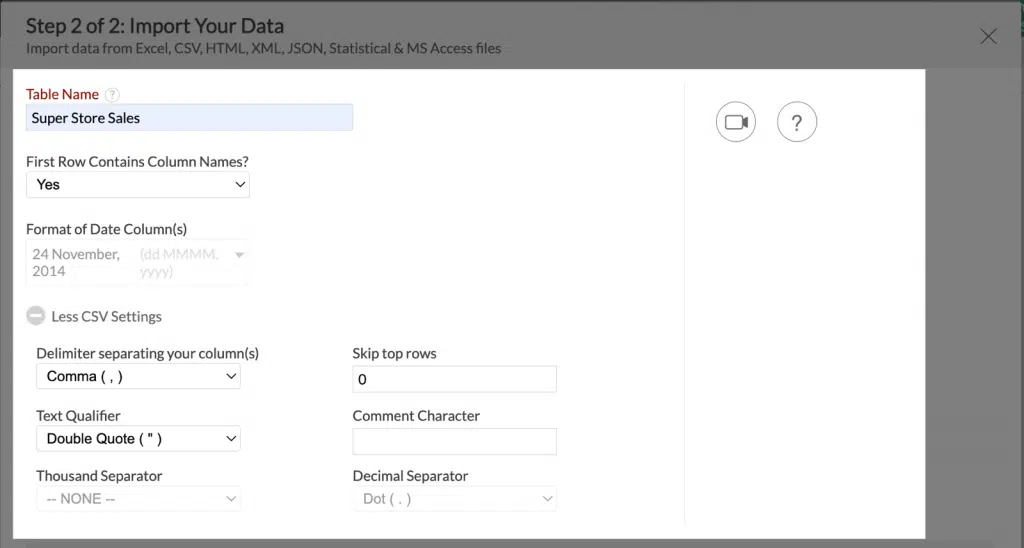
Note: The Format of Date column and the CSV Settings (thousand separator and Decimal separator) cannot be changed after using the Prepare Data option.
New Extension: Qualtrics for Zoho Desk
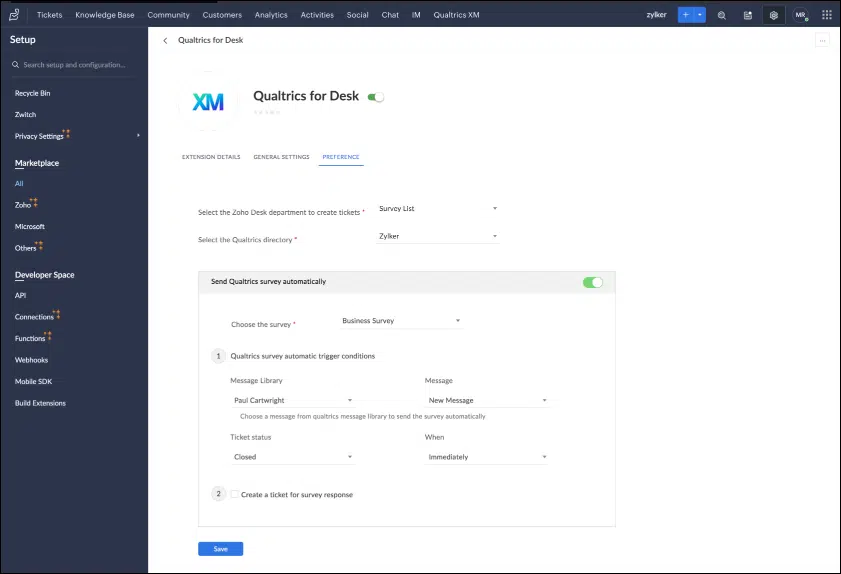
With this extension, you can prepare your agents to provide better customer support by adding templates and sending feedback/survey mails automatically. By sending those surveys, you can get feedback from the customers, which is made available to your agents in Zoho Desk. Also, you can create contacts and multiple email templates in your Qualtrics account, as well as define conditions for emails to be triggered automatically based on user response.
Key Features:
- Add new customers to Qualtrics database from within Zoho Desk.
- Send Qualtrics feedback/survey mails for every support ticket in Zoho Desk.
- Make as a requirement to get survey response as tickets for every feedback/survey mail sent.
- Measure the agents’ activity in terms of the support provided.
Please note that the compatible editions for the Qualtrics for Zoho Desk Extension are Standard, Professional, Enterprise, CRM Plus, and Zoho One.
SMS Surveys Now Available in Zoho Survey
Sending surveys via automated SMS allows you to get actionable, real-time feedback from respondents. It’s one of the most cost-effective ways to reach out to them, since it doesn’t require additional hardware or software to set up and manage.
Zoho Survey is currently integrated with Twilio, SMS Magic, and Clickatell SMS channels. You need an account with at least one of these platforms to share your surveys through SMS.
Zoholics to Take Place in Three Cities Across United States
As part of Zoho’s customer-focused approach, the United States’ edition of Zoholics 2023 will happen in not just one, but three cities: Pleasanton, California; Jersey City, New Jersey; and Austin, Texas.
According to Zoho, their flagship user conference returns with their “most customer-focused experience to date.” Each Zoholics event will last two days. Attendees will learn how to work smarter from Zoho experts while connecting with fellow customers in an intimate and friendly environment. Their goal is “to make Zoholics the most informative and down-to-earth software conference you’ve ever been to.”
Zoholics USA 2023 will take place during the following dates:
- April 20-21, 2023: Zoholics Pleasanton (California)
- April 26-27, 2023: Zoholics Jersey City (New Jersey)
- May 3-4, 2023: Zoholics Austin (Texas)
For more details, agendas, and registration, click here.
Zoho’s Live Webinars and Tutorials
Live Webinar: Zoho Books Integration with Zoho Projects
Join Zoho experts to learn more about creating and sending invoices, estimates, and expenses from Zoho Books to Projects. Learn how to retrieve tasks, timesheets, users, bugs, and contacts associated with your projects from Books. Register here.
Live Webinar: Zoho Expense Integration with Zoho Projects
Talk to Zoho experts and discover how you can read Expenses reports to track your project expenses. Get to know how you can view expenses along with the actual cost and compare it with the project budget. You’ll also learn how to upload receipts associated with projects and submit them for approval. Register here.
Tutorial: Import Data to Zoho Analytics from Cloud Drives
That’s all for now, IC readers! See you soon for more Zoho updates from InterConnecta!
Interested in adding these new features to your Zoho system? We can help! Learn more about our Zoho Consulting Services and ask us for a free consultation.